
This post is well suited for beginners. There is him too As a PDF document.
There are two types of sensors to grasp vibrations, or better vibrations, the substrate. The simpler species is a vibrating contact. This can be a small ball in a tube that establishes or opens a connection between two contacts by a push. Another type of design uses a small leaf spring at the end of which a flywheel is sitting. If the component experiences a thrust, the spring feaks and closes the contact to a second spring or the housing. Such vibration sensors can only "on" and "out", they do not know any interim tones and say nothing about the magnitude of the bumps.
I use the other type of sensor here. It is an acceleration sensor or accelerometer. Its function is comparable to the spring contact just described. Only here are the springs made of wafer-thin piezo tiles. If they are bent by gravity or by vibrations, then submit a voltage that is proportional to the bend amplitude, including the effect. This can determine the violence of a shock.
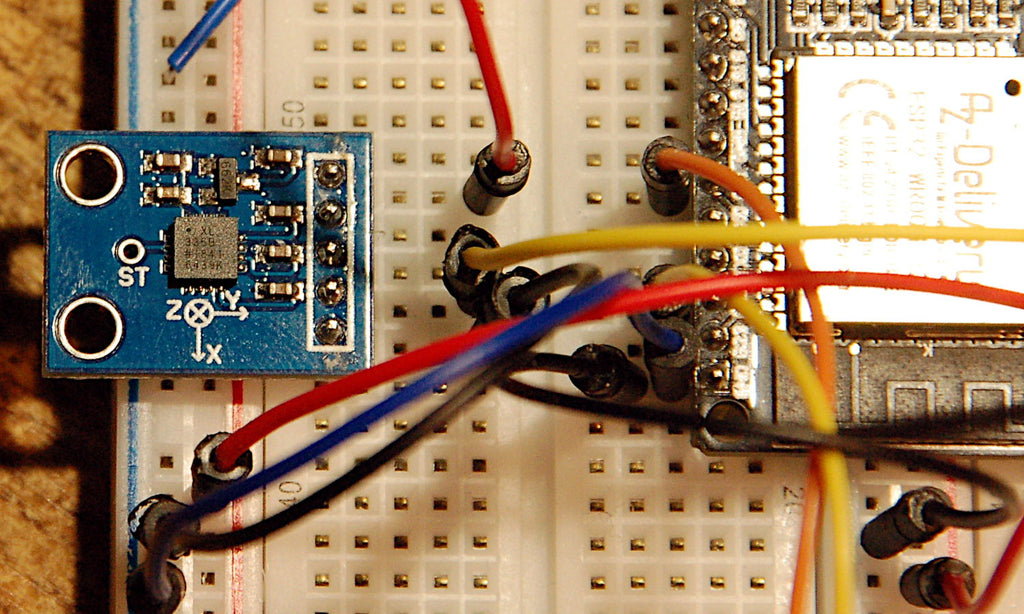
Figure 1: XL335B-3-axis accelerometer with analog outputs
But in this case, too, there are two types of sensors that differ primarily in the type of data transmission to the controller. Some are controlled and queried via the I2C bus, the others give the tension of the piezoplätchen, of course via an integrated amplifier, to analog outputs. Such a component is the ADXL335, which is installed here in the Bob (Break Out Board) GY-61 together with a voltage regulator. I will describe below how to build a seismometer or a seismograph from the GY-61, an OLED display and an ESP32. I also show another option of how to permanently store and retrieve data in the flash of the ESP32 and there is a representation of the functioning of an accelerometer. Follow me on a new tour on the topic
Micropython on the ESP32 and ESP8266
today
Measure and represent soils
Hardware
|
1 |
|
|
1 |
GY-61 ADXL335 acceleration sensor 3-practice inclination angle module |
|
1 |
|
|
1 |
|
|
1 |
MOREGANG ROTARY Potentiometer With protective resistance 3590s 10k ohm |
|
1 |
LED |
|
1 |
Resistance 270 Ohm |
|
various |
Jumper cable |
|
|
Digital voltmeter (DVM) for calibration |
The structure is very easy, the OLED display is connected to the I2C bus. An ESP32 takes over the chief position. For its use, two Breadboards are required, which are connected to a power rail in the middle, so that you can get there with the intervals of the pin rows and cable can also be inserted on the edge.

Figure 2: Earthquake sensor - structure
I chose the ESP32 because it can come up with a 12-bit ADC and also offers a selection of the voltage area. The plenty of GPIO pins will benefit from the further expansion of the project. In principle, an ESP8266 would also be suitable for the scope of this project. The display has a size of 128x64 pixels and serves, among other things, to graphically present the measured values.
The software
For flashing and the programming of the ESP32:
Thonny or
Used firmware for the ESP32:
The micropython programs for the project:
SSD1306.PY Hardware driver for the OLED display
oled.py API for OLED displays
earthquake.py Operating program
Micropython - Language - Modules and Programs
To install Thonny you will find one here Detailed instructions (English version). There is also a description of how that Micropython firmware (As of 05.02.2022) on the ESP chip burned becomes.
Micropython is an interpreter language. The main difference to the Arduino IDE, where you always flash entire programs, is that you only have to flash the Micropython firmware once on the ESP32 so that the controller understands micropython instructions. You can use Thonny, µpycraft or ESPTOOL.PY. For Thonny I have the process here described.
As soon as the firmware has flashed, you can easily talk to your controller in a dialogue, test individual commands and see the answer immediately without having to compile and transmit an entire program beforehand. That is exactly what bothers me on the Arduino IDE. You simply save an enormous time if you can check simple tests of the syntax and hardware to trying out and refining functions and entire program parts via the command line before knitting a program from it. For this purpose, I always like to create small test programs. As a kind of macro, they summarize recurring commands. Whole applications then develop from such program fragments.
Autostart
If the program is to start autonomously by switching on the controller, copy the program text into a newly created blank tile. Save this file under boot.py in WorkSpace and upload it to the ESP chip. The program starts automatically the next time the reset or switching on.
Test programs
Programs from the current editor window in the Thonny-IDE are started manually via the F5 button. This can be done faster than the mouse click on the start button, or via the menu run. Only the modules used in the program must be in the flash of the ESP32.
In between, Arduino id again?
Should you later use the controller together with the Arduino IDE, just flash the program in the usual way. However, the ESP32/ESP8266 then forgot that it has ever spoken Micropython. Conversely, any espressif chip that contains a compiled program from the Arduino IDE or AT-Firmware or Lua or ... can be easily provided with the micropython firmware. The process is always like here described.
The mode of action of the ADXL335
To record it, I only look at the vertical direction. This is the z-axis with the sensor. It points upwards when you put the sensor flat on the table. The corresponding piezoelement is then through the weight fG bent down to the mass. If I turn the bob into the vertical alignment, perpendicular to the table area, there is no bend because gravity works towards the tile. If I turn the bob by another 90 °, so it is on the head, then the tile is bent in the opposite direction. The measuring amplifier sets tensions for the three cases at the output that corresponds to the inequality chain in Figure 3.
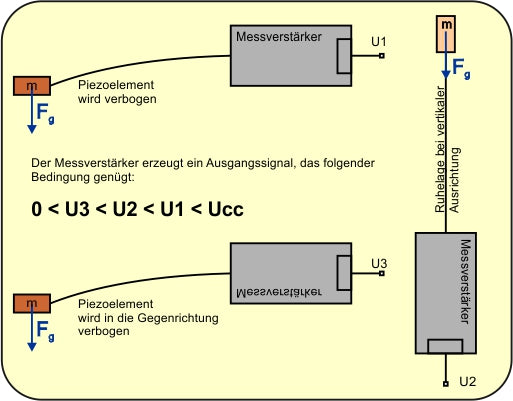
Figure 3: Working principle of a piezoelement in the ADXL335
Let us stay parallel to the table with the first orientation. The output voltage U1 is the reference size for our project. In this case, the ADC of the ESP32 provides a value of around 2368 counts. If I now knock on the table top with my finger, then I vibrate it, it will quickly lift and lower it. You can illustrate this if you clamp the one end of a ruler with one hand at the table and briefly tap the protruding end with the other hand. Incidentally, this is also a model for the functioning of the piezo elements.
Now another thing comes into play, the inertia of the mass. This is the property of bodies to oppose a change in motion. This results in forces fTwhose direction of the direction of the movement is precisely opposite.
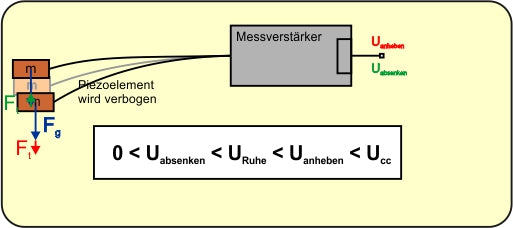
Figure 4: Filigal balance and tensions when swinging
If the swinging table top raises the bob, the inertia of the mass M At the piezoarm, which wants to stay in its place, a stronger bending of the piezoelement down, it creates a higher voltage at the output of the measuring amplifier andlift. In return, the bend of the element is reduced for the same reason when the bob goes down with the table top. The tension at the output drops.
The vibrations are carried out for the resting position and bring a difference between the meter points (counts) from 18 (light knock) to 242 (punch) on the ADC. The latter corresponds to approx. 0.5g, as we will see later. The earth acceleration g = 9.81m/s² causes the Newtonian Formula FG = m • g the bending of the piezoelement. The inertia leads through negative acceleration A, regarding the direction of movement, for inertia fT = m • a that the weight fG overlaid. When lifting, the forces are added, when lowering the weight reduces the amount of fT.
The circuit

Figure 5: Seismometer - circuit
The circuit of the three assemblies is very easy. The voltage supply should take place for long-term operation from a 5V plug-in power supply. During the development, the PC supplies the circuit via the USB bus.
The program
You can divide the tasks of the program into three areas: record, represent and provide the PC the data for further evaluation.
The capture takes place in the main loop and automatically starts by the occurrence of a soil oscillation, which at least reaches the double level of the background noise. The measurement duration is then half a second. During this time, a list is set up, the values of which are written in a file in the flash of the ESP32 after the timer has expired. The naming of the files is automatically via a counter. But let's just take a look at it in turn.
From machine import Pin code, ADC, Softi2c
From time import sleep,Ticks_MS
From sys import exit
From OLED import OLED
From ESP32 import NVS
We need PIN objects, the ADC and the I2C interface, further sleep and Ticks_MS for delays. With exit() we build an orderly exit from the program. The OLED class delivers the API for the display. NVS is acronym for non -volatile storage = non -fleeting storage. What is meant is a storage option for 32-bit integer values and so-called blobs, these are bytes objects in the flash memory. In order to be able to access it, we create an NVS object that we give the identifier of a namespace. Each namespace can absorb and keep the designer pairs of value. We test that once.
>>> From ESP32 import NVS # Import class
>>> NVS=NVS("test") # Naming room test create
>>> bare=B "This is a test" # Create bytes object
>>> bare # Control
B'Das is a test '
>>> NVS.set_blob("text",bare) # Name is text, The bytes object is value bare
>>> Container=bytearar(30) # To read out we need a bytes array
>>> NVS.get_blob("text",Container) # Bring blob into the array, 16 bytes are
16
>>> print(Container[:16]) # reflect the content
bytearar(B'Das is a test ')
>>> NVS.Set_i32("number",1234567)
>>> NVS.get_i32("number")
1234567
>>> NVS.commit() # Write values in the flash
Now you can switch off - after the next boat the values are still there.
>>> From ESP32 import NVS # Import class
>>> NVS=NVS("test") # Reference name room test
>>> NVS.get_i32("number")
1234567
>>> NVS.erase_key("number") # delete the key number
>>> NVS.get_i32("number")
Traceback (custody recent call load):
File "" , line 1, in <modules>
Oserror: (-4354, 'ESP_ERN_NVS_NOT_FOUND')
NVS=NVS("Quake")
We create an I2C object. And hand it over to the OLED instance D.
I2C=Softi2c(scl=Pin code(22),sda=Pin code(21),freq=400000)
Dheight=64
D=OLED(I2C,Heightw=Dheight)
D.writer("Earthquake 1.0",0,0)
At GPIO36 we declare the ADC instance ADC And set the voltage range measured on the ADXL335, as well as the resolution to 12 bit. The highest counting value is then 4095.
adcpinnumber=36
adcpine=Pin code(adcpinnumber)
ADC=ADC(adcpine)
ADC.attack(ADC.Attn_11db) # 150 - 2450 MV
ADC.Width(ADC.Width_12bit)
# 0 ... 4095; LSB = 3149mv/4095cnt = 0.769mv/CNT
# @313mv/g (313mv/g)/0.769mv/cnt = 408cnt/g
# Lsbg = 1/408cnt/g = 2.45mg/cnt
LSBC=3149/4095 # MV / CNT
LSBG=LSBC/313  # g / mv
With the help of a DVM and the 10-speed potentiometer, I determine the voltage value for which I get 4095 counts (count = counting value unit). The voltmeter lies on GPIO36 and GND. I can use it to calculate the LSB (= voltage value for 1 CNT) of the ADC.
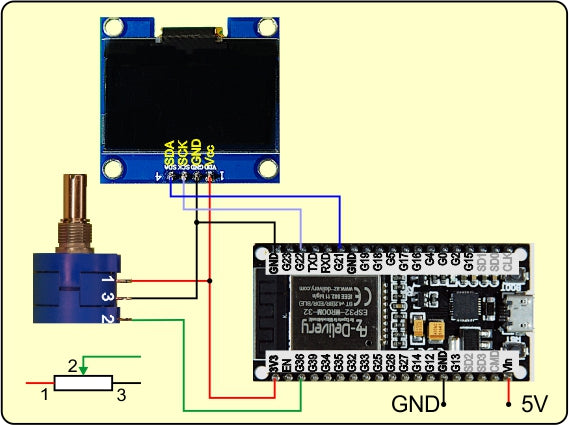
Figure 6: Oaks of the ADC
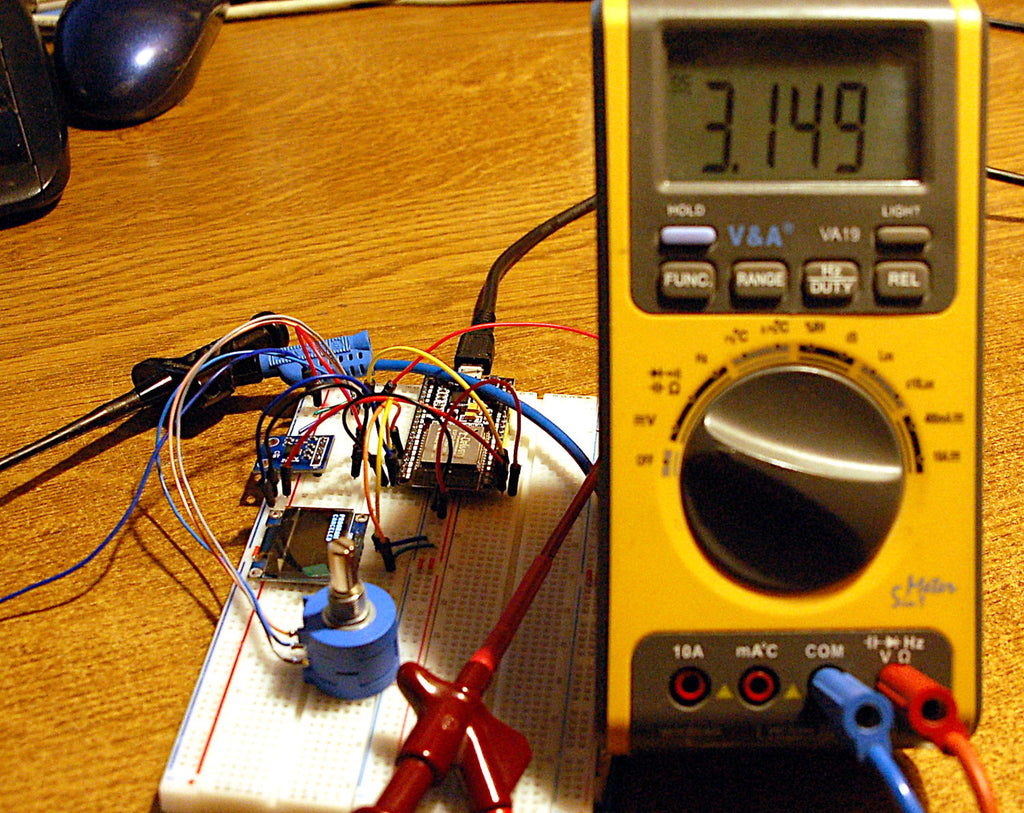
Figure 7: Earthquake sensor-ADC accommodation
On the ADXL335 there is a voltage of 0.313V at the Z output when it is parallel to the table area. He then captures the earth's acceleration G. If I share this voltage through the LSB of the ADC, then I get the number CNT for 1g: 408 CNT/g. The reciprocation of this is the LSB of recording the acceleration LSBG = 2.45 milli-g/CNT. This enables me to convert the ADC values directly into acceleration values.
I am only interested in the ground acceleration because I need it to calculate the acceleration values by moving the substructure. I also content myself with the ADC value. In order to reduce the noise (deviations due to random measurement errors from ADXL335 and ESP32-ADC), I determine the average of 1000 individual measurements. S0 I put in the NVS-Namespace Quake under the key S0 away.
S0=0
SU=4095
so=0
n=1000
M=[]
for I in range(n):
    S=ADC.read()
    M.append(S)
    S0+=S
    SU=min(SU,S)
    so=Max(so,S)
S0=intimately(S0/n)
NVS.Set_i32("S0",S0)
NVS.commit()
At the same time, I have determined the largest and the smallest measured value. From this I calculate the biggest deviation down and above. The values hike with print() in the terminal window.
DSU=intimately(S0-SU+1)
DSO=intimately(so-S0+1)
DSC=Max(DSU,DSO)*2
DS = DSC*LSBC*LSBG
print ("s0 = {}; su = {}; so = {}; dsu = {}; dso = {}".format(S0,SU,so,DSU,DSO))
print ("Rowing: {} cnts = {: 0.2f} g".format(DSC,DS))
The demolition button is the flash button on GPIO0, the LED of GPIO2 tells us when a measurement is running.
bussy=Pin code(2,Pin code.OUT,value=0)
button=Pin code(0,Pin code.IN,Pin code.Pull_up)
I define a few functions to distribute the work. This creates overview through modularization.
def Getadc(n):
    S=0
    for I in range(n):
        S+=ADC.read()
    return intimately(S/n)
The measurement results are also a little smoothed by means of average. The function gets0() Get the S0 value from the NVS-Namespace Quake.
def gets0():
    return NVS.get_i32("S0")
In the main loop, every quake event is recorded in numbered files. readata() reads these files and saves the values in the list S. I hand over the number of the file to the parameter when I called n.
def readata(n):
    global S
    S=[]
    Surname="Data"+Str(n)+".csv"
    wither open(Surname,"R") AS F:
        for line in F:
            line=line.strip()
            IF  line.find(";") != -1:
                No,S1=line.split(";")
                Val=intimately(S1)
                S.append(Val)
So that the changes to the list S penetrate from the function, I declare it as global. The list is emptied and the file name is put together. I open the file with the wither-In the end, I don't need to worry about closing the file.
The for-loop itotes over the entire content and delivers to me in line the text of a line. The line feed, "\ n" = Ascii 10, is turned off. Then I'm looking for one ";". If the separator is included, I split the line in running index and value. I turn the text into a integer and attach it as a new list element S at.
For the display in Excel I can get through the content of the list s convert() prepare in a tricky way. About the parameter V I hand over part of S or the whole list. I get S0 and open a file data.csv for (over) writing. The string S0 receives the form "; 2376". In the for loop, I put lines of the form "23; 2482; 2376 \ r" together and write them in the file. Windows needs a wagon return \ r at the end of the line instead of the line feed. I can rightly upload the file DATA.CSV (CSV = Character Separated Values) created in this way from the ESP32 to the PC to Thonny's working directory and open it in Excel. More details later.
def convert(V):
    S0=gets0()
    wither open("Data.csv","W") AS F:
        print("Elements:",len(V))
        S0=";"+Str(S0)
        for n in range(len(V)):
            line=Str(n)+";"+Str(V[n])+S0+"\ r"
            F.write(line)
The function that I reuse the most frequently is Time-out(). The Closure creates a non -blocking software timer. I hand over the expiry time as a value in milliseconds. The reference to the function returned compare() I simply assign a identifier. So I can check the timer status at various points in the program - not yet expired: False, completed: True.
def Time-out(T):
    begin=Ticks_MS()
    def compare():
        return intimately(Ticks_MS()-begin) >= T
    return compare
The function can be used to present the values on the display graphic() call. As in convert() As an argument, I give a list or a slice (disc) of it. S [: 50] brings the values from place 0 to 49, S [45: 132] get the values from 45th to 131. The variable length remember the number of elements, ML Get half the display height. min() and Max() determine the greatest and smallest value. I need the two for the scaling so that each data point fits on the display. With S0 and Max() the largest deviation is calculated in the calculation of the scaling factor yfactor received. The first for loop must be able to react to two cases-more than 64 values or up to 64 values in the list. This clarifies the conditional assignment goal. With a maximum of 64 values, a run is enough.
Delete the display, pull the center line, the first X value is 0. The full number of the scaled difference from measured value S1 and rest value S0 is subtracted by half the display height because positive Y values must be above the center line. The upper left corner of the display has the coordinates 0 | 0, the lower 0 | 63.
The inner for loop now grabs up to 62 values from the list, starting at the position of the position, which specifies the outer loop. The X value for the end point of the line from X1 | Y1 results as a difference between J and i. The factor 2 stretches the x-axis, otherwise the curve lines follow too close to each other. This explains why with a display with 128 pixels width of the index I only runs up to a maximum of 64 points in front of the end of list. Draw the line and place X1 | Y1 on X2 | Y2. So far we have only worked in the buffer. show() sends the content to the display.
Pushing the values can take a long time. It depends on how long the Scandauer is chosen. With the Flash key you can therefore cancel the process.
So we are about to 0.
We get a value from the ADC, calculate the deviation from the basic value S0, the absolute value of it comes after DS. If the value is outside of the background noise, a scan is triggered. The trigger-Wirt we send to the terminal and the display. Then a file name is generated and a file for writing is opened.
n=0
while 1:
    S1=Getadc(3)#adc.read ()
    trigger=S1-S0
    DS=Section(S1-S0)
    IF DS > DSC :
        bussy.on()
        print("{}. Trigger: {}".format(n,DS))
        D.writer("{}. Trig {}".format(n,trigger),0,4)
        Surname="Data"+Str(n)+".csv"
        sock.broadcast((Str(n)+"\ r").encode(),receiver)
        wither open(Surname,"W") AS F:
We create an empty list S And put the timer on half a second. over Now refers to the function compare() that we through over() can call. Why this is possible, although the function Time-out() with the return of the reference compare() has already ended, you can do that here read.
            S=[]
            over=Time-out(500)
As long as over() the value False The 500 milliseconds have not yet expired. Because our timer does not block the program, we can do a bunch of things in the meantime. We hang the measured value on the list, get a new, sleepy one millisecond and check the status of the flash key. If it is pressed at that moment, we leave the loop
            while need over():
                S.append(S1)
                S1=Getadc(5)
                sleep(0.001)
                IF button.value()==0: break
The number of values is determined and communicated to us in the terminal, then we write the list in the file and increase the counter for the next trigger.
AW=len(S)
print("***** please wait {} values *****".\
format(AW))
for I in range(AW):
F.write("{}; {} \ n".format(I,S[I]))
print("==================================")
n+=1
IF button.value()==0:
D.clearall()
D.writer("Program",0,0)
D.writer("Canceled",0,1)
sys.exit()
With the Flash key you can leave the program in an orderly manner.
The evaluation with Excel
With convert() If you can make a file that can be opened directly in Excel without any problems. In the Open Dialog File, Select the type CSV. Navigate to the working directory and open the file data.csvthe one you have with convert().

Figure 8: File type CSV
Mark the three columns A, B and C. Due to the constant S0 values in column C, we simply get the zero line. It corresponds to the center line in the display. Now open the menu Insert.
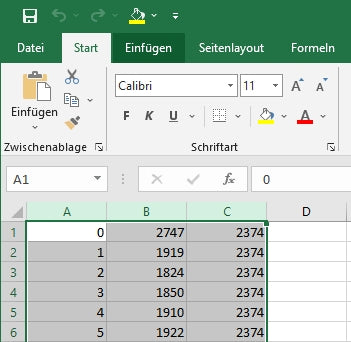
Figure 9: Mark columns - Insert
Fold the menu Point-xy diagram on and click on Points with interpolated lines
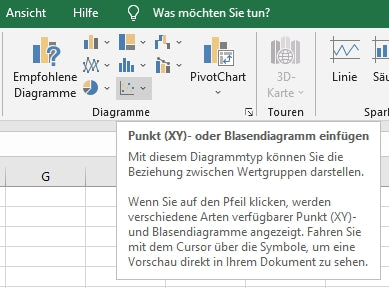
Figure 10: point-xy diagrams
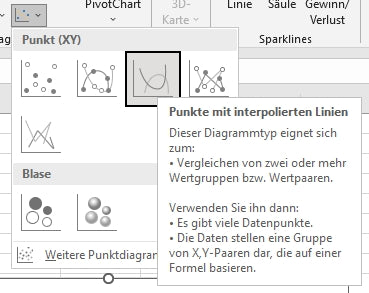
Figure 11: Points with interpolated lines
Complete!
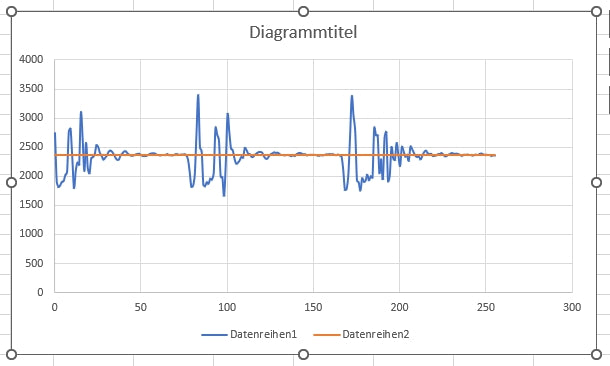
Figure 12: Finished diagram
You can zoom in with the start of the recording, right -clicking on the diagram - data.
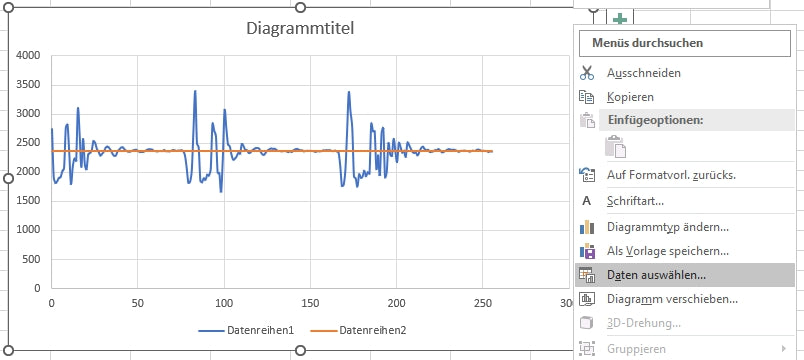
Figure 13: Select data
Replace the value behind C $ with a smaller one - ok
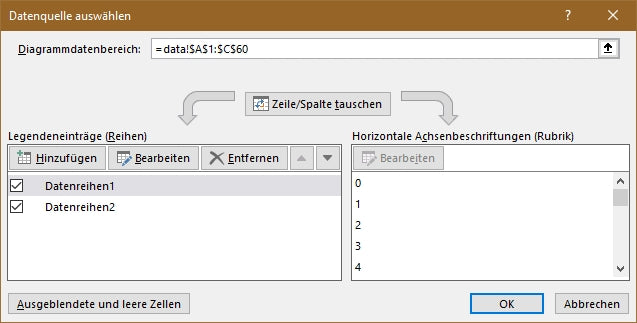
Figure 14: Show excerpt
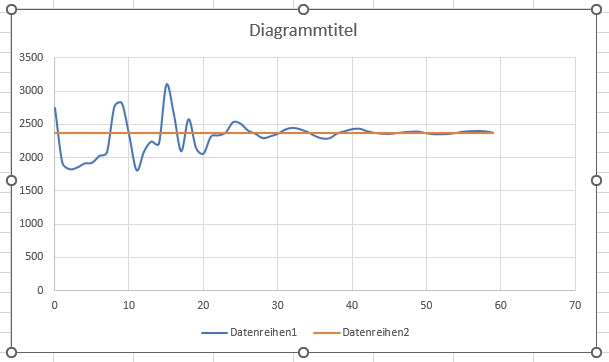
Figure 15: Zoom on the start area
So we arrived for today. What's next?
How about a radio contact from the ESP32 to the PC? Or would you like it if you could hike with the joystick through the measurement curves on the display? Practical would certainly be a recording of the measured values on an SD memory card. If it were also subsequently determined when the triggering event took place, it would not be to be scoffed at either, right? Because we have so far only considered the recording of the vertical Z direction, we should perhaps also include the X and Y axis, because earthquake waves can also spread longitudinal or transverse on the level.
I'm a few thoughts about it.
See you then.


4 comments
Gerrit Paul
Hallo Michael,
sehr gerne habe ich Interesse an Deinem Projekt.
Andreas Wolter
Wolfhard Jording: ich vermute, dass es nicht direkt funktionieren wird, da die Pinbelegung anders ist. Eventuell passen die Bibliotheken nicht. Einen Test wäre es wert. Schreiben Sie uns gerne Ihre Erfahrungen als Kommentar. Für mehr Praxis oder auch einen kleinen Einstieg können Sie die Beiträge zum Raspi Pico durchgehen.
Grüße,
Andreas Wolter
AZ-Delivery Blog
Wolfhard Jording
Ob man den ESP32 durch einen Rasberry Pi Pico W ersetzen kann? Der wird ja in der Regel schon mit Python programmiert. Leider bin ich noch nicht ganz so fit in Python.
Michael
Witzig – habe identisches Projekt mit einem ESP8266, GY521 (MPU6050) & Arduino IDE erledigt. Mit SD Karte & Webinterface.
Bei Interesse schicke ich mein Werk gerne als PN